

Micro Pump Sample Testing: What Data Should OEMs Record
MICRO PUMP BASICS
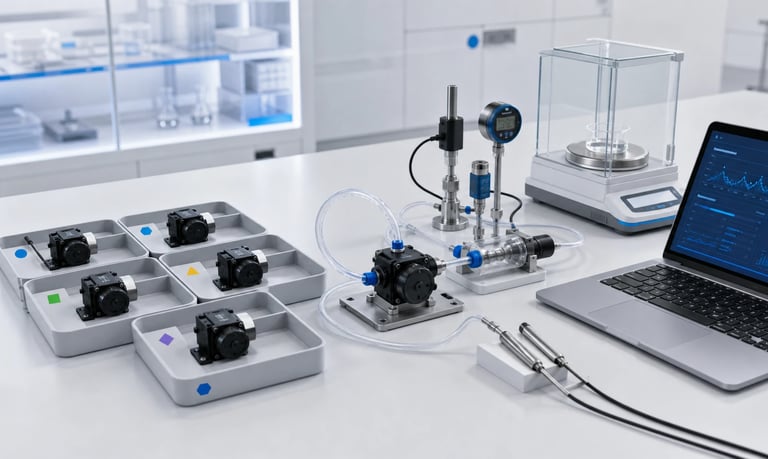
A useful micro pump sample test records the exact pump and fluid-path configuration, controlled test conditions, measurement setup, raw flow or dose data, pressure, current, speed, temperature, priming, noise, faults, observations, deviations, and sample identity so OEM teams can compare options and repeat decisions.
Micro Pump Sample Testing: What Data Should OEMs Record?
Micro pump samples are often tested early, before the final reservoir, tubing, electronics, enclosure, and software are available. These tests can still support a strong selection decision if the setup and conditions are recorded clearly.
A spreadsheet containing only pump model and measured flow is rarely enough. Flow changes with voltage, speed, fluid, temperature, inlet restriction, outlet pressure, tubing, fittings, and test method. Without this context, a result cannot be reproduced or compared fairly with another sample.
The objective of sample testing is to create traceable evidence: what was tested, how it was tested, what happened, what remains uncertain, and whether the sample is worth integrating into the next design stage.
Start with a Written Test Objective
Define the decision the test must support.
Examples include:
Compare two pump technologies
Confirm approximate flow and pressure range
Evaluate a production fluid
Check prime time or suction lift
Assess dose repeatability
Compare motor and control options
Screen tubing or wetted materials
Measure noise in an early enclosure
Identify thermal or duty-cycle risk
Select samples for longer validation
The objective controls the test matrix and data resolution. A quick feasibility screen does not require the same scope as a design-verification test, but it should still record enough information to prevent misuse.
Write pass, fail, or ranking criteria before testing where practical. If the test is exploratory, state that explicitly and avoid presenting the result later as final validation.
Assign a Unique Sample Identity
Every pump should have an identifier that follows it through receiving, testing, teardown, storage, and failure analysis.
Record:
Internal sample ID
Manufacturer and model
Supplier part number
Serial number, lot, or date code where available
Hardware revision
Pump-head and motor type
Driver or controller revision
Date received
Source and purchase or sample-request reference
New, run-in, used, repaired, or modified condition
Custodian and storage location
Photograph labels, connectors, ports, and overall condition before testing. If no supplier serial number exists, apply a noninterfering internal ID.
Do not reuse an identifier after replacing the motor, pump head, diaphragm, tubing, valve, or firmware. Create a configuration revision or new sample identity so data remain traceable.
Record the Complete Pump Configuration
A model family may contain several motors, gear ratios, pump heads, tubes, diaphragms, valves, and control interfaces.
Capture:
Pump mechanism
Motor type and nominal voltage
Gear ratio where provided
Pump-head revision
Roller or chamber configuration
Peristaltic tube part number and dimensions
Diaphragm, valve, seal, and chamber materials
Integrated driver and firmware
Connector and pinout
Mounting orientation
Adjustable settings such as occlusion
Supplier-rated operating limits and their source
Record information directly from the sample and controlled supplier documents. Do not rely only on an email title or a distributor listing.
If wetted materials or specifications are unconfirmed, mark them as unknown rather than guessing.
Record the Fluid-Path Configuration
The pump and fluid path form one system. Document the components on both sides of the pump.
For the inlet, record:
Reservoir type and venting
Fluid level relative to the pump
Pickup geometry
Tube material, inner diameter, wall, and length
Fittings, valves, filters, sensors, and manifolds
Number and radius of bends
For the outlet, record:
Tube material, dimensions, and length
Elevation change
Fittings, filters, valves, dampers, sensors, and nozzles
Receiving container or chamber
Back-pressure control method
Use a simple diagram or photograph with measurement points. Port pressure can differ significantly from a remote gauge or chamber value.
If the setup changes, assign a new configuration code. Do not combine results from open discharge and a production nozzle under one unlabeled column.
Record the Test Fluid
Fluid identity is essential because viscosity, density, surface tension, chemistry, particles, gas content, and temperature affect pump behavior.
Record:
Fluid name and internal code
Supplier, formulation, or preparation method
Lot or batch
Concentration
Density and reference temperature
Viscosity and measurement method
Temperature at the pump inlet
Particles, fibers, crystals, or suspended solids
Bubbles, foam, or dissolved gas
Fluid age and storage history
Hazard and handling controls
For gas pumps, include gas identity, humidity, temperature, actual or standardized flow basis, and atmospheric pressure.
If a substitute fluid is used, state which properties it represents and which it does not. Water testing can support setup and comparison, but it should not be treated as proof of production-fluid performance.
Record Ambient and Environmental Conditions
Early sample tests often occur on an open bench, yet temperature, atmospheric pressure, humidity, and mounting can affect the result.
Record:
Date and time
Ambient temperature
Relative humidity where relevant
Local atmospheric pressure for gas and vacuum testing
Test altitude or location
Pump orientation
Open-bench, chamber, or enclosure condition
Ventilation or airflow
Supporting surface and mounting
For environmental tests, add exposure temperature, humidity, duration, ramp, soak, recovery, and whether the pump was operating.
Do not report "room temperature" when the requirement depends on a defined range. Measure and record the actual condition.
Record the Electrical Setup
Voltage at the power supply is not necessarily voltage at the pump. Wiring, connectors, current limits, and driver losses matter.
Record:
Power-supply model and settings
Voltage at the pump during operation
Current limit
Measured current and power
Cable length and conductor size
Driver, H-bridge, or controller
PWM frequency and duty
Analog, frequency, step, or digital command
Motor speed or feedback signal
Acceleration and deceleration
Direction and braking
Firmware and software version
Capture startup current with equipment fast enough for the event. A slow display may show only steady current.
For brushless or smart pumps, record communication settings, commands, status data, and fault codes. For stepper pumps, record step frequency, microstep mode, current, and motion profile.
Record Measurement Equipment and Methods
Results are only as useful as their measurement method.
For every instrument, record:
Manufacturer and model
Internal equipment ID
Range and resolution
Calibration or verification status
Sensor location and orientation
Sampling rate
Filtering or averaging
Data-logging software and version
Document the method for flow, dose, pressure, vacuum, temperature, speed, noise, vibration, current, leakage, and other variables.
State whether pressure is absolute, gauge, differential, or vacuum relative to atmosphere. State whether gas flow is actual, standard, normal, or mass flow and provide the reference conditions.
Record conversions, density values, formulas, and rounding. Preserve original readings so calculations can be checked later.
Record Flow Across the Operating Range
One flow value at nominal voltage is not a pump curve.
Measure flow at relevant combinations of:
Minimum, typical, and maximum command
Minimum and maximum supply voltage
Minimum and maximum inlet condition
Minimum and maximum outlet pressure
Fluid temperature and viscosity range
Full and low reservoir level
Clean and loaded filters
New and aged consumables
For liquid flow, note whether the method is gravimetric, volumetric, or sensor-based. Record collection time, density, evaporation control, and individual replicates.
For gas flow, record measurement pressure, temperature, gas, and flow basis.
Keep the raw command-to-flow points. A fitted equation or summary chart should not replace the original data.
Record Pressure and Vacuum Together with Flow
Flow without pressure context can be misleading. Measure inlet and outlet conditions close to the pump where practical.
Record:
Inlet gauge or absolute pressure
Outlet gauge or absolute pressure
Differential pressure where useful
Steady and transient peaks
Sensor position
Filter and valve state
Reservoir and outlet elevation
For liquid pumps, inlet vacuum can reveal restriction, incomplete refill, tube collapse, or a blocked vent. Outlet pressure reveals the load created by tubing, valves, filters, and nozzles.
For gas pumps, do not combine free flow, ultimate vacuum, and shutoff pressure as one performance point. Record the full flow at the required inlet and outlet absolute conditions.
If a test intentionally reaches a blocked condition, state its duration and confirm it remains within safe equipment limits.
Record Dosing Data as Individual Results
For dosing applications, keep every dose rather than only the average.
Record:
Target dose
Pump command
Individual measured mass or volume
Dose number and time
Mean, spread, and error calculation
First dose after startup or idle
Delay between doses
Rotor start position where available
Valve and reverse-motion timing
Temperature, pressure, and reservoir level
Include minimum, typical, and maximum doses. Short doses can behave differently from steady flow because acceleration, partial roller cycles, pressure buildup, nozzle wetting, and motor stopping represent a larger fraction of the command.
If a result is excluded because of a documented spill or measurement fault, retain it with the exclusion reason. Do not remove inconvenient results without explanation.
Record Priming and Restart Behavior
Priming is a process, not a yes-or-no property.
Record:
Dry or wet starting condition
Inlet and outlet path state
Vertical lift and tube length
Prime speed or command
Time to first liquid or target vacuum
Time to stable bubble-free flow
Number of attempts
Current, pressure, and temperature
Fluid temperature and viscosity
Success or failure mode
Test dry prime, partial prime, wet restart, low reservoir, longest idle, and restart against residual pressure where relevant.
For gas pumps, record evacuation time from one defined absolute pressure to another and pressure rise after stop.
Do not report only "self-priming" without the fluid, lift, tube, speed, and time.
Record Current, Speed, and Temperature
Electrical and thermal data help explain flow changes and expose operating margin.
Record over time:
Pump command
Actual motor or rotor speed
Supply voltage at the pump
Current and input power
Motor, driver, gearbox, and pump-head temperature
Fluid inlet and outlet temperature
Enclosure or ambient temperature
Flow and pressure
Capture startup, warm-up, steady state, speed changes, and shutdown. A single final temperature does not show whether the system was still heating.
Correlating current with pressure and speed helps diagnose restriction, excessive tube occlusion, valve problems, or driver limiting. Current alone is not proof of flow.
Define the temperature measurement location and attachment method. Surface measurements can vary with sensor contact and airflow.
Record Noise and Vibration Context
Noise data without setup details are difficult to compare.
Record:
Microphone or accelerometer model
Position, distance, orientation, and mounting
Background noise
Room or enclosure condition
Supporting surface
Pump mount and fastener torque
Tube and cable routing
Pump speed, flow, and pressure
Fluid and bubble condition
Overall and frequency data where used
Capture priming, normal operation, valve events, blockage, and shutdown if they matter to the product.
An informal phone recording can document an observation but should not be presented as a calibrated acoustic result.
Use the same fixture and conditions for comparative screening. A quiet pump can become loud when the product structure amplifies it.
Record Leakage, Backflow, and Shutoff
Document the state before, during, and after the pump stops.
Measure as relevant:
External leakage
Inlet air entry
Internal backflow
Siphoning
Pressure decay
Post-stop dripping
Stored-volume release
Valve leakage
Tube or fitting retention
State fluid, pressure, vacuum, elevation, rotor position, valve state, observation time, and detection method.
A brief visual inspection may miss slow leakage that becomes significant during a long idle. Use an observation period tied to the application.
Photograph leak locations and preserve failed components for analysis.
Record Fault Tests and Recovery
Sample testing should include a limited set of safe, relevant faults when they influence selection.
Possible conditions include:
Empty source
Blocked inlet
Blocked outlet
Kinked or disconnected tubing
Pump stall
Feedback or sensor loss
Communication interruption
Minimum voltage
Immediate power removal
Repeated restart
Record:
Fault applied and method
Time and operating state
Detection signal and delay
Current, pressure, speed, flow, and temperature
Controller response
Delivered amount during the fault
User or system indication
Recovery and final state
Do not perform destructive or hazardous faults without an approved procedure, containment, equipment limits, and safety controls.
Record Wear and Change over Time
Early durability tests can reveal whether performance is stable enough for further integration.
At defined checkpoints, record:
Operating time or cycles
Starts, stops, and reversals
Fluid, speed, pressure, and temperature exposure
Flow or dose drift
Prime time
Current and temperature
Noise and vibration
Leakage and backflow
Tube, diaphragm, valve, seal, gear, and bearing condition
Maintenance or adjustments
Use consistent reference conditions at each checkpoint. If the test condition changes every time, trends are difficult to interpret.
Photograph wear and retain replaced parts with their sample identity. Do not report only final failure time without the loading history and failure mode.
Record Qualitative Observations Separately
Engineer observations are valuable when separated from measured data.
Examples include:
Visible bubbles
Tube movement
Valve chatter
Unusual odor
Color change
Foam
Intermittent clicking
Condensation
Particle deposits
Difficult connector handling
Service-access problems
Timestamp observations and connect them to the raw data. A note such as "flow unstable" should be replaced with a description of magnitude, pattern, and condition where possible.
Distinguish fact from interpretation. "Bubble appeared at inlet fitting" is an observation; "fitting leak caused flow loss" is a hypothesis until confirmed.
Photograph and Diagram the Setup
Photographs can reveal tube routing, sensor position, reservoir level, clamps, fittings, wiring, and mounting details that a spreadsheet misses.
Capture:
Overall test setup
Pump label and sample ID
Inlet and outlet routing
Sensor and gauge locations
Reservoir and receiving vessel elevation
Electrical connections
Mounting and enclosure
Fluid condition
Failures, wear, leaks, and deposits
Use a scale or reference dimension where helpful. Avoid relying on photographs alone for dimensions.
Store files with traceable names connected to the test record. A folder of camera-generated filenames becomes difficult to use later.
Preserve Raw Data and Processing Steps
Raw sensor logs, balance readings, controller messages, and photos should be retained alongside processed charts and summaries.
Document:
Original file name and location
Date and time synchronization
Column names and units
Sensor scaling
Filtering and averaging
Removed or invalid points
Density and conversion values
Analysis script or spreadsheet version
Plot and report revision
Do not overwrite raw files with cleaned data. Preserve a read-only original and create a traceable processed copy.
If a filter changes the apparent pulsation or transient peak, state it. Keep unfiltered data where instrument bandwidth permits.
Automated analysis can reduce calculation errors, but formulas and software still require verification.
Compare Samples Fairly
Use the same fluid, path, pressure, voltage, temperature, measurement method, and acceptance calculation for each candidate whenever possible.
Compare at the same application requirement, not necessarily the same command. For example, two pumps should be compared at the same delivered flow and outlet pressure when evaluating current, heat, or noise.
Record differences that cannot be removed:
Different tube sizes
Different integrated drivers
Different pump-head geometry
Different control resolution
Different allowable speed range
Different run-in or priming requirements
A weighted score can support selection, but retain the underlying values and rationale. Do not let one combined number hide a critical failure or untested condition.
Separate measured result, supplier statement, assumption, and engineering judgment.
Document Deviations and Test Interruptions
Real tests rarely follow the plan perfectly. Record deviations immediately.
Examples include:
Wrong fluid temperature
Instrument range exceeded
Power interruption
Bubble entering the line
Tube or fitting replacement
Firmware update
Manual adjustment
Spill or lost sample
Test paused for maintenance
Sensor recalibration
State which data may be affected and whether the run was repeated.
Do not silently combine pre- and post-change data. A clear deviation record is more useful than an apparently clean dataset with hidden configuration changes.
If a sample is modified to improve performance, retain its original baseline and describe the modification.
End with a Decision and Open-Risk List
A sample-test report should conclude with what the evidence supports.
Possible dispositions include:
Reject for a defined reason
Continue with a different tube, driver, or fluid path
Request supplier clarification or another sample
Proceed to integrated prototype testing
Proceed to longer life or environmental testing
Hold pending material or compliance documentation
List open risks and untested conditions, such as production-fluid compatibility, hot enclosure performance, loaded filter pressure, tube life, altitude, or supplier variation.
Do not describe a sample as fully validated when only bench feasibility has been shown. Define the next test and owner where the process requires it.
Sample-Test Record Checklist
Test objective, decision, and criteria defined
Unique pump and configuration identity assigned
Supplier, model, revision, lot, and condition recorded
Pump mechanism, motor, driver, and consumables documented
Complete inlet and outlet fluid path recorded
Fluid or gas identity and relevant properties captured
Ambient, atmospheric, mounting, and enclosure conditions recorded
Electrical supply, commands, feedback, and firmware documented
Instruments, locations, ranges, calibration, sampling, and filtering recorded
Flow measured across relevant commands and pressures
Inlet vacuum and outlet pressure stored with flow
Individual doses retained with timing and first-dose behavior
Priming, restart, and evacuation conditions defined
Voltage, current, speed, temperature, and warm-up logged together
Noise and vibration setup documented
Leakage, backflow, shutoff, and observation time recorded
Fault application, detection, response, and recovery captured
Wear checkpoints and maintenance history retained
Photos, diagrams, qualitative observations, and failed parts linked
Raw data protected and processing steps traceable
Deviations, assumptions, decisions, and open risks documented
Common Sample-Testing Mistakes
Recording flow without pressure, fluid, voltage, or temperature
Testing multiple samples without unique identities
Changing tubing or firmware under the same configuration name
Using water results as proof for a viscous production fluid
Comparing pumps at different delivered flow or pressure
Saving only averages and deleting individual doses
Calling a pump self-priming without lift and time data
Reporting vacuum without absolute or gauge reference
Recording power-supply voltage instead of voltage at the pump
Measuring temperature before thermal stabilization
Comparing noise from different fixtures or rooms
Replacing a failed part without retaining it
Saving charts but not raw data
Hiding deviations and manual adjustments
Treating a sample feasibility test as production validation
Frequently Asked Questions
What is the minimum data to record for a micro pump sample?
At minimum, record sample identity, pump configuration, fluid path, medium, temperature, voltage, command, flow or dose, inlet and outlet pressure, measurement method, and observations.
How many pump samples should an OEM test?
There is no universal number. Early screening may use a small set, while variation, destructive, life, and validation work require a risk-based sample plan with the responsible quality team.
Should sample testing use the final production fluid?
Use it whenever practical. A substitute should match the properties relevant to flow, suction, pressure, materials, particles, bubbles, and temperature and should be documented as a limitation.
Why should raw data be saved if a summary report exists?
Raw data allow later verification, different analysis, transient review, and investigation after design changes or field issues. Summaries can hide filtering, outliers, and drift.
How should two pump samples be compared fairly?
Compare them at the same application output and controlled fluid, pressure, temperature, voltage, path, measurement, and enclosure conditions while documenting unavoidable differences.
Is successful sample testing enough to approve production?
No. Sample testing supports selection and risk reduction. The integrated OEM product still requires representative design verification, life, environmental, fault, production, and applicable compliance testing.
Kamoer Micro Pump Sample Support
Kamoer can help OEM teams define sample configurations, operating points, fluid-path conditions, control interfaces, measurements, technical questions, and representative follow-up tests for micro pump selection and integration.
Related Stories
Kamoer Fluid Tech (Shanghai) Co., Ltd.
pump@kamoer.com